
I once ran a Facebook ad campaign and spent $200 without a single sale. At the time, I could not tell you what went wrong, because I was not tracking anything meaningful. I had not even set up a Facebook Pixel because I genuinely did not know what it was or why it mattered. All I just knew was I had a product, I had a budget, and I hit “Boost” hoping for the best.
One specific ad still haunts me: a $3 cost per click on a digital product that sold for $3. I spent over $50 on that single ad and got zero sales. I was paying almost as much for a single click as my entire product was worth.
If any part of that story sounds familiar, this article is for you. You cannot improve what you do not measure, and most failed campaigns, mine included, fail not because the product was bad, but because nobody was tracking the numbers that actually reveal what is happening. Let’s go through the 15 marketing metrics that genuinely matter and exactly how to track each one. But before then, let’s see why you need to study those marketing metrics.
Why Marketing Metrics Matter More Than You Think
Before my $200 disaster, I was essentially guessing. I would look at how many likes or comments a post got and assume that meant something. It did not. Marketing metrics are simply the numbers that tell you what is actually happening between someone seeing your ad and someone buying your product, and without them, you are flying blind, exactly as I was.
Data-driven decisions consistently outperform guesswork because guesswork repeats the same mistakes while data reveals exactly where to fix them.
Vanity Metrics vs Actionable Metrics — Know the Difference First
This distinction changed everything for me once I finally understood it.
Vanity metrics like followers, likes, impressions, and video views feel good but rarely tell you whether your business is actually making money. I used to feel encouraged by post engagement, not realizing engagement and sales are completely different things.
Actionable metrics like conversion rate, cost per click, return on ad spend, and customer acquisition cost directly inform a decision. If a vanity metric goes up, your ego feels better. If an actionable metric goes up, your bank account does.
Now, let’s look at the metrics you should study closely when promoting a product or service.
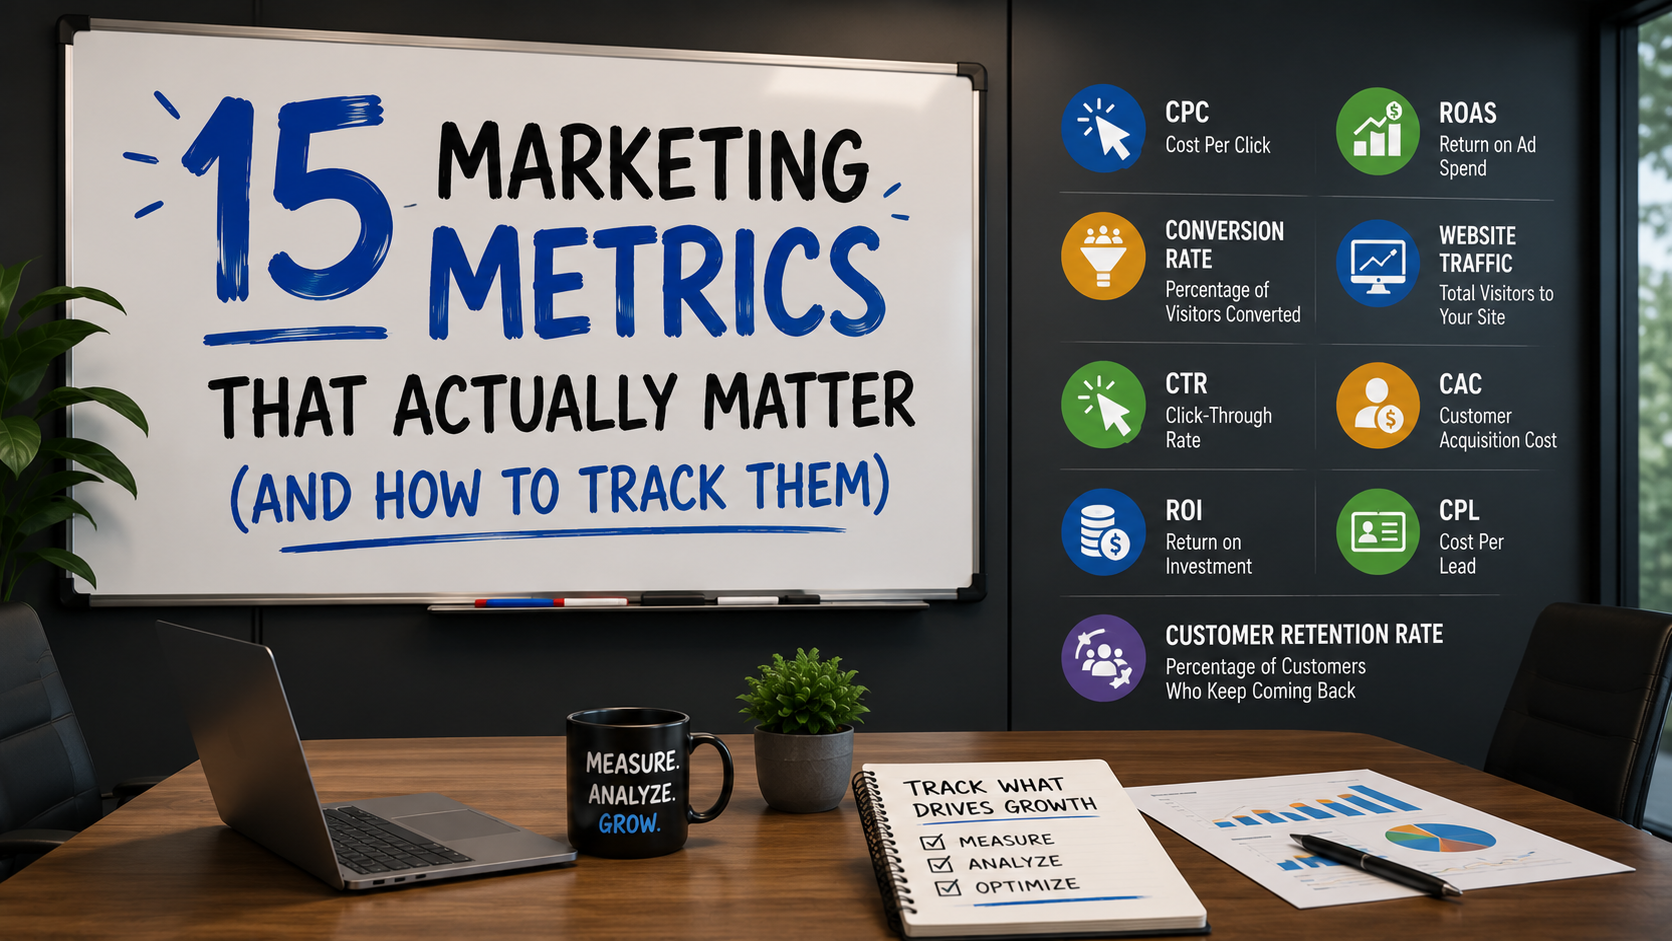
15 Marketing Metrics That Actually Matter
1. Website Traffic
What it measures: How many people are visiting your website or landing page, and where they came from. Organic search, paid ads, social media, or direct visits.
Why it matters: Traffic alone is meaningless without context. I had decent traffic on my ecommerce ad, but without knowing my traffic source quality, I could not tell whether visitors were genuinely interested buyers or just curious clickers. In fact, when I am running a broad targeting campaign, I always check the locations I am getting impressions from.
How to track it: Use a free analytics platform (Google Analytics or your ad platform’s built-in reporting) to see total visits and where they originated.
2. Conversion Rate
What it measures: The percentage of visitors who complete a specific desired action, such as a purchase, a form submission, or a sign-up.
Formula: (Number of conversions ÷ Total visitors) × 100
Why it matters: This is the single most important number I ignored during my $200 failure. I had clicks arriving on my page, but I never once checked what percentage of those clicks actually converted into sales. If I had, I would have caught the problem within the first day instead of burning through my entire ad budget.
Read, 15 Marketing Portfolio Examples (And How to Build Your Own)
How to improve it: Clarify your offer, simplify your checkout process, and make sure your landing page directly matches what your ad promised.
3. Click-Through Rate (CTR)
What it measures: The percentage of people who saw your ad and actually clicked on it.
Why it matters: A low CTR tells you your ad creative or headline is not compelling enough to earn attention. A healthy CTR combined with zero sales, which is exactly what happened with my $3 product ad, tells you the problem lives somewhere after the click, not in the ad itself.
How to improve it: Test different headlines, stronger visuals, and calls to action that speak directly to your specific audience’s needs.
4. Customer Acquisition Cost (CAC)
What it measures: How much it costs you, on average, to acquire one paying customer.
Formula: Total marketing spend ÷ Number of new customers acquired
Why it matters: This is where my $50-for-a-$3-product disaster becomes painfully clear. My cost to potentially acquire a customer was already higher than my entire product price before I had even made a single sale. If I had calculated CAC before scaling that campaign, I would have paused immediately. For example, you spend $5 to sell a single product that is priced at $3. You see that the campaign is not profitable.
How to apply this: Always compare your CAC against your actual profit margin per sale. If acquiring a customer costs more than what that customer pays you, the math simply does not work, no matter how good your product is.
5. Customer Lifetime Value (LTV)
What it measures: The total revenue you can expect from one customer over the entire time they buy from you, not just their first purchase.
Why it matters: A high CAC can still be worthwhile if your LTV is high enough, meaning customers return and buy repeatedly. My early business mistake was treating every sale as a one-time transaction instead of thinking about repeat purchases, which made my acquisition costs feel far more painful than they needed to.
How to improve LTV: Focus on retention, repeat purchase incentives, and genuine customer relationships rather than only chasing first-time buyers.
6. Return on Ad Spend (ROAS)
What it measures: How much revenue you generate for every dollar spent on advertising.
Formula: Revenue from ads ÷ Amount spent on ads
Why it matters: My $200 campaign had an ROAS of exactly zero, the worst possible outcome. Understanding ROAS from day one would have shown me immediately, in one simple number, that the campaign was failing rather than letting me discover it slowly through a shrinking bank balance.
What influences ROAS: Your targeting accuracy, your ad creative quality, your landing page, and your actual product-market fit all directly affect this number.
7. Return on Investment (ROI)
What it measures: The overall profitability of a marketing effort, factoring in all costs, not just ad spend, but also product cost, platform fees, and time.
Why it matters: ROAS looks purely at ad spend versus revenue, but ROI gives you the fuller, more honest picture of whether a campaign was genuinely profitable once every cost is considered.
How to work on this: Calculate ROI for major campaigns periodically, not just ROAS, to understand true profitability rather than just top-line revenue generated.
8. Bounce Rate
What it measures: The percentage of visitors who land on your page and leave without taking any action or visiting another page.
Why it matters: A high bounce rate signals that visitors are not finding what they expected, often because the ad promised one thing and the landing page delivered something confusing or mismatched.
Read, Why Your Google Ads Aren’t Converting and How to Actually Fix It
How to improve it: Ensure your landing page message matches your ad message exactly, improve page load speed, and make your value proposition clear within the first few seconds.
9. Cost Per Lead (CPL)
What it measures: How much you spend, on average, to generate one lead, like someone who provides contact information but has not yet purchased.
Formula: Total campaign spend ÷ Number of leads generated
Why it matters: For businesses using a lead generation strategy before selling, CPL tells you whether your top-of-funnel spending is efficient before you even get to the sales conversation.
10. Lead-to-Customer Conversion Rate
What it measures: Of the leads you generate, what percentage actually become paying customers.
Why it matters: Generating leads is not enough on its own. I have seen businesses celebrate a huge list of leads that never convert into real revenue. This metric reveals whether your leads are genuinely qualified or just casually interested.
How to improve it: Improve lead qualification upfront, and ensure your follow-up process is fast and genuinely helpful rather than generic.
11. Email Open Rate and Click Rate
What it measures: Open rate shows how many people opened your email. Click rate shows how many people clicked something inside it.
Why it matters: Open rate tells you whether your subject line worked, while the click rate tells you whether your actual content and offer worked. And click rate generally tells you far more about real interest than open rate alone.
How to improve them: Write specific, curiosity-driven subject lines, and make sure your email content delivers genuine value before ever asking for a sale.
12. Customer Retention Rate
What it measures: The percentage of customers who continue buying from you over time, rather than buying once and disappearing.
Why it matters: Keeping an existing customer is almost always cheaper than acquiring a new one. My early business focused entirely on new customer acquisition through ads, without any real strategy for bringing previous buyers back, a mistake that made every sale feel more expensive than it needed to be.
13. Churn Rate
What it measures: The percentage of customers who stop buying or cancel a subscription over a given period.
Why it matters: Especially relevant for subscription or recurring revenue businesses, churn reveals whether customer satisfaction and product value are strong enough to keep people coming back.
How to reduce churn: Improve customer experience, follow up proactively, and address complaints before they turn into lost customers.
14. Marketing Attribution
What it measures: Which specific marketing touchpoint, like an ad, a blog post, or an email, deserves credit for a completed sale.
Why it matters: Without attribution, you cannot confidently tell which channel is actually driving results and which is wasting budget. This is precisely why setting up a Facebook Pixel matters so much. Without it, as in my early $200 campaign, Facebook has no way of connecting your ad spend to actual purchases, leaving you completely blind to what is working.
How to apply this: Set up proper tracking, such as pixels, UTM links, or your platform’s built-in attribution tools, before spending significant ad budget, not after.
15. Average Order Value (AOV)
What it measures: The average amount a customer spends per transaction.
Why it matters: Increasing AOV through bundling, upsells, or free shipping thresholds can dramatically improve profitability without needing any additional traffic or ad spend at all.
How to improve it: Offer complementary product bundles or a small incentive for spending slightly more per order.
Which Metrics Matter Most, Based on Your Business Type
Ecommerce businesses should prioritize conversion rate, average order value, ROAS, cart abandonment rate, and LTV.
Service-based businesses should focus on cost per lead, lead-to-client conversion rate, CAC, and retention rate.
Read, Why Your Facebook Ads Aren’t Converting and How to Actually Fix It
Content creators should track email subscriber growth, returning visitors, and engagement that leads to genuine monetization, not just raw view counts.
Common Marketing Measurement Mistakes
Some of the common mistakes I see every day are;
Tracking too many metrics at once, which creates overwhelm instead of clarity.
Measuring only traffic, exactly as I did, without checking what that traffic actually did afterward.
Never setting up proper tracking: My missing Facebook Pixel meant I was making decisions with zero real data.
Reacting to short-term fluctuations instead of looking at trends over a reasonable time period.
Focusing on clicks instead of conversions, celebrating activity that never actually turns into revenue.
How to Build a Simple Marketing Dashboard
You do not need complicated software to start. A simple spreadsheet tracking your spend, clicks, conversions, CAC, and ROAS for each campaign gives you enough clarity to make better decisions than I had during my early failed campaigns. Review it weekly at minimum, and compare campaigns against each other honestly rather than judging each one in isolation.
What I Would Do Differently Today
If I could go back to that $200 campaign, the fix would not have required more money; it would have required setting up my Facebook Pixel correctly, checking my CTR and conversion rate within the first day instead of waiting, and calculating my CAC against my product price before scaling anything. None of these fixes is complicated. They simply require knowing which numbers to look at and looking at them before the damage is done, rather than after.
Frequently Asked Questions
Which marketing metric is the most important?
Conversion rate and CAC together give you the clearest picture, since one tells you if your funnel works and the other tells you if it is profitable. Neither number alone tells the full story.
How often should I review marketing metrics?
Weekly at minimum during active campaigns, and daily during the first few days of any new ad campaign. This will help you to discover early common problems like mine, where I had a $3 CPC on a $3 product before the entire budget was gone.
What is a good conversion rate?
This varies by industry, but 2 to 3 percent is often considered a reasonable baseline for cold ecommerce traffic, with well-optimized campaigns reaching higher.
Should small businesses track all 15 of these metrics?
No. Start with conversion rate, CAC, ROAS, and CTR. These four alone would have saved me from my $200 mistake. Add the others as your marketing complexity grows.
Leave a Reply